Everything you need to know about all 39 of Vancouver’s top ‘hoods
It’s one thing to think that you live in the best neighbourhood in town. It’s quite another to have a list that can prove it. Now you can, with the city’s first-ever quantitative ranking of all 39 neighbourhoods. So read on, dig in, and find out how your own slice of the city stacks up. Or, if you would rather a more personalized version (hey, we’re not here to judge if you prioritize coffee shops over schools), check out our interactive calculator.
1. False Creek
Score: 56.8Population: 5,795 There should be little doubt that the communities that were built along False Creek in the last two decades, from Yaletown on the north side to the Olympic Village on the south shore, are resounding successes. But there should be even less doubt that they owe much of their existence to the community that came before them. False Creek South, with its artful mixture of mixed-income residential, people-friendly retail and abundant green spaces, is the personification of what urban theorist Jane Jacobs thought an urban community should be. And yet, this ranking will come as a surprise to some people, given that False Creek South tends to sit in the shadows of the towers to its north and east. But it’s time to give False Creek South its rightful place in the sun.Its success was anything but assured when it was originally conceived of by planners and politicians more than 40 years ago. Indeed, it was more of an experiment than anything, a test of whether you could turn a tract of post-industrial urban land on the south side of False Creek into a thriving mixed-use community. Would people even want to live that close to the downtown core, and in that kind of social and architectural configuration? The answers to those questions might seem obvious now, but at the time it was far more uncertain. False Creek’s heritage, after all, didn’t exactly suggest that it would be an ideal location for young families. “The place was on fire half the time,” says Ray Spaxman, who was the city’s newly-appointed director of planning at the time the False Creek South plan was created. “It was like a horrible industrial area, and at one point there were lots of people living in shacks above the water. Everything was awful down there.”That changed quickly, though, and the log booms and saw mills were slowly replaced by a fledgling patchwork of co-operatives and market housing all tied together by a sense of common purpose. Richard Evans, an architect who made the decision to move into one of those cooperatives with his family in 1986, says that spirit has created a community that’s unique in the city today—one that’s both affordable and admirable. “Imagine a whole city where the planners, the creative people, the politicians, and the business people were all talking about what they could do together. Everybody held this amazing vision. I’m sure there were detractors, and I’m sure there were people that didn’t agree with that. But it prevailed—and look what we have.”Affordable: 66.9 | Low Crime: 62.7 | Economy: 66.0 | Diversity: 35.6 | Restaurants: 49.1 | Kids: 40.0 | Commute: 68.6 | Singles: 32.0 | Smart and Engaged: 66.4 | Green Space: 62.0 | Stable: 54.1

2. West End
Score: 56.6 Population: 39,910The West End absolutely crushes it when it comes to affordability, low levels of property crime, and access to green space—thank you, Stanley Park—but gets edged by False Creek due to the fact that it’s an awfully difficult place to raise kids and one where there’s a lot of turnover. For singles and the childless, though, it might be a better bet than our overall winner.Affordable: 71.7 | Low Crime: 81.2 | Economy: 50.6 | Diversity: 47.3 | Restaurants: 51.0 | Kids: 14.7 | Commute: 70.8 | Singles: 72.6 | Smart and Engaged: 53.7 | Green Space: 99.4 | Stable: 8.9
 3. Lynn Valley
Score: 55.7Population: 25,500No surprises here: Lynn Valley rates highly when it comes to green space, the economic clout of its residents, and the quality of its schools. Even less surprising? That it’s bad for singles and lacks diversity. Still, if you’re looking for an explicitly family-friendly neighbourhood, this might be your best bet. Just don’t delay, lest you get priced out by the West Van inheritance money that’s been pouring in of late.Affordable: 52.1 | Low Crime: 78.7 | Economy: 78.8 | Diversity: 34.8 | Restaurants: 25.7 | Kids: 74.0 | Commute: 30.9 | Singles: 25.3 | Smart and Engaged: 47.9 | Green Space: 85.3 | Stable: 83.1 
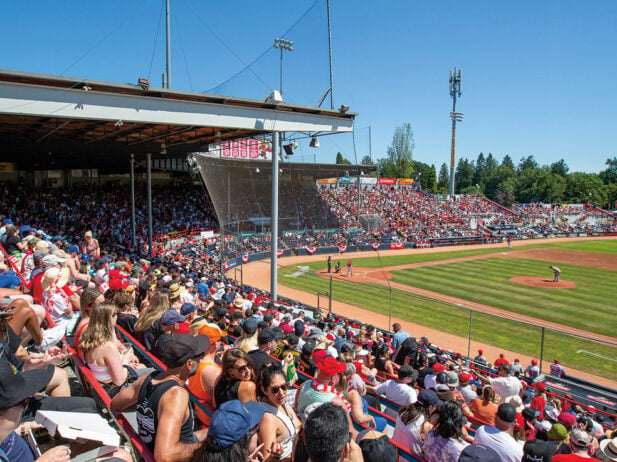
4. Main St. (Riley Park)
Score: 55.4Population: 21,800Riley park is Vancouver’s Goldilocks neighbourhood: neither too strong nor too weak in any of the categories. It scores strongly on economic and cultural diversity, its population of smart and engaged residents, and its economic vitality, and misses the mark a bit in terms of property crime and the number of singles (and volume of opportunities for them to change that status). One amenity that wasn’t factored into our scoring: proximity to Nat Bailey Stadium, and the epic summer nights to which it routinely plays host.Affordable: 59.0 | Low Crime: 37.7 | Economy: 76.5 | Diversity: 70.6 | Restaurants: 45.5 | Kids: 47.6 | Commute: 45.5 | Singles: 40.4 | Smart and Engaged: 60.0 | Green Space: 43.7 | Stable: 64.3 
5. Downtown
Score: 55.2Population: 16,400The idea of Downtown being an attractive place to live would have been a difficult one for previous generations to stomach. But no more—and no wonder. With a huge range of restaurants, bars, and coffee shops to choose from (just look at that score), a lively social scene, and the city’s easiest commute, it’s an increasingly popular neighbourhood in which to live as well as work and play. As a result, you can bet that population figure is on its way up.Affordable: 53.7 | Low Crime: 81.0 | Economy: 40.2 | Diversity: 68.7 | Restaurants: 99.9 | Kids: 18.0 | Commute: 82.7 | Singles: 98.4 | Smart and Engaged: 49.4 | Green Space: 17.7 | Stable: 10.9

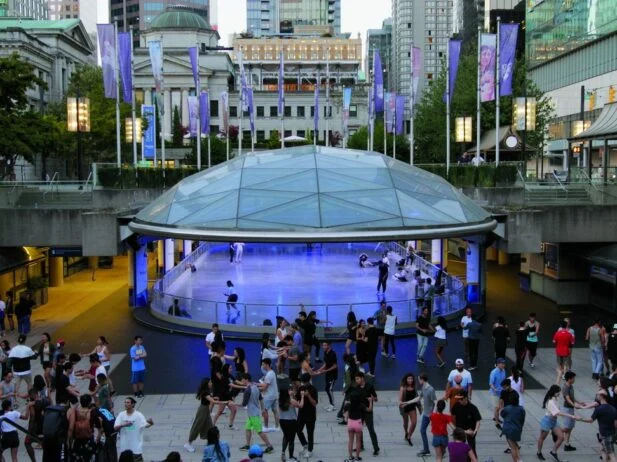
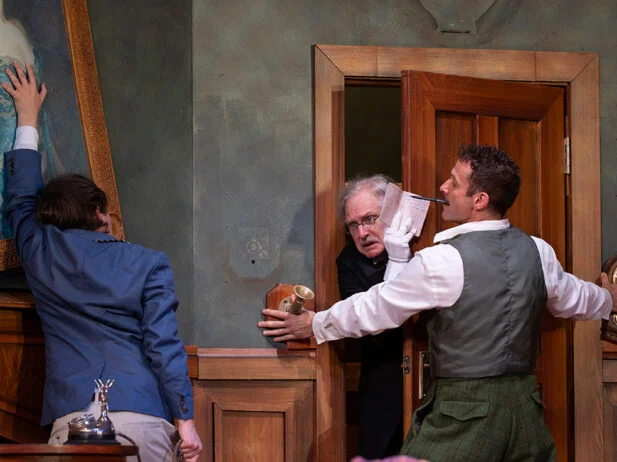
6. Olympic Village/Fairview
Score: 54.8Population: 19,440Remember when people were worried that the Olympic Village was going to be a failure? Those days are clearly behind it now, and with the gorgeous new BMO Theatre Centre joining a rapidly expanding roster of bars and restaurants and a booming craft beer scene, it’s safe to assume that even better ones are on the horizon for those who live in the Village.Affordable: 62.3 | Low Crime: 61.2 | Economy: 69.2 | Diversity: 54.4 | Restaurants: 82.5 | Kids: 13.2 | Commute: 75.1 | Singles: 54.9 | Smart and Engaged: 76.5 | Green Space: 21.2 | Stable: 21.0 
7. UBC
Score: 54.5Population: 19,440Once upon a time, in a land far, far away—okay, the late 1990s—UBC was a sleepy community of students, professors, and academic staff living in a clutch of low-rise buildings. Today, it’s practically a city unto itself, with a growing number of residential towers and all the amenities to match. That drive towards density will kick into an even higher gear once the UBC subway extension finally gets built. For anyone using the 99 B-Line, that can’t happen soon enough.Affordable: 50.6 | Low Crime: 80.1 | Economy: 9.8 | Diversity: 79.6 | Restaurants: 42.6 | Kids: 68.3 | Commute: 59.0 | Singles: 59.2 | Smart and Engaged: 41.2 | Green Space: 99.5 | Stable: 19.5 
8. Yaletown
Score: 54.3Population: 11,585Sure, the shape of Yaletown’s boundaries has changed a bit over the last decade or two. But can you blame developers for trying to tie their projects to the name—or buyers for wanting it as their home turf? After all, if you’re looking for a neighbourhood that personifies the best qualities of post-Expo Vancouver, it has to be Yaletown. Sure, it’s maligned in some quarters of the city. But we think that’s as much a function of jealousy as anything.Affordable: 37.1 | Low Crime: 86.0 | Economy: 79.5 | Diversity: 60.1 | Restaurants: 75.3 | Kids: 32.6 | Commute: 62.6 | Singles: 44.8 | Smart and Engaged: 53.8 | Green Space: 51.2 | Stable: 40.6 
9. Kitsilano
Score: 54.1Population: 43,195It wasn’t that long ago that the idea of Kits being ranked the 9th best neighbourhood in Vancouver would have been heresy. But it retains most of the traits that once made it the city’s most coveted ‘hood, from its educated and engaged citizens to its range of urban amenities and enduring socio-economic stability. It might even be getting short-changed a bit, given that its adjacency to some of the city’s best beaches isn’t part of our formula.Affordable: 54.0 | Low Crime: 60.9 | Economy: 68.9 | Diversity: 39.3 | Restaurants: 57.5 | Kids: 48.2 | Commute: 68.6 | Singles: 65.9 | Smart and Engaged: 76.7 | Green Space: 32.1 | Stable: 24.8 
10. Killarney
Score: 54.0Population: 33,885The idea of a finding a starter home might seem about as likely as finding a unicorn for young Vancouver families today, but it’s not pure fantasy yet—not in Killarney, anyways. With real estate prices that haven’t gone completely parabolic, a bit of green space, good schools, and lots of cultural and economic diversity, it’s a great option for young families that are still chasing the dream. Added bonus for those families? It’s just a short drive to the nearest IKEA.Affordable: 74.0 | Low Crime: 56.1 | Economy: 47.5 | Diversity: 80.1 | Restaurants: 22.9 | Kids: 62.2 | Commute: 27.8 | Singles: 34.7 | Smart and Engaged: 25.1 | Green Space: 59.9 | Stable: 72.0
Who else made the list?
11. South Granville: 53.912. Kensington-Cedar Cottage: 53.713. Capilano: 53.114. Hastings Sunrise: 52.715. Seymour/Deep Cove: 52.7 16. South Cambie: 52.617. Dundarave/Ambleside: 52.618. Crosstown: 52.019. Gastown/Chinatown: 51.920. Commercial Drive: 51.921. Renfrew-Collingwood: 51.422. Coal Harbour: 51.323. Lonsdale: 51.324. Mount Pleasant: 51.125. Pemberton/Pemberton Heights: 50.8 26. Sunset: 50.827. Victoria-Fraserview: 49.728. Strathcona: 49.429. Downtown Eastside: 48.730. Horsehoe Bay: 48.1 31. Marpole: 47.432. Caulfeild: 47.233. Shaughnessy: 46.534. West Point Grey: 46.235. Kerrisdale: 46.036. Dunbar: 44.337. British Properties: 43.738. Arbutus Ridge: 43.539. Oakridge: 39.0Image Credits: False Creek, Sébastien Launay; Olympic Village, Bruce Irschick; UBC, Leo Bodv; Yaletown, Shinsuke Ikegame; Kitsilano, Tourism Vancouver